5 IELTS Writing Task 1 Band 8.5 Sample

IELTS writing task 1 - Bar chart

Introduce you to practice IELTS writing 5 writing Task 1 special samples or 8.5 Writing. With 5 sample articles you can use to refer to good ideas, special sentence structures used for writing, and how the writer connects the paragraphs together to create a coherent link.

#Sample 1:

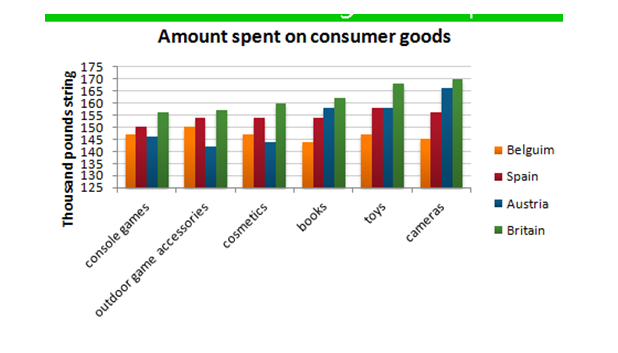
“The bar chart below give information about five countries spending habits of shopping on consumer goods in 2012. Summarize the information by selecting and reporting the main features, and make comparisons where relevant.”

IELTS writing task 1 - Bar chart

IELTS writing task 1 – Bar chart

The chart compares the spending habits of shoppers in five European countries on six consumer products, recorded console games, outdoor game accessories, cosmetics, books, toys and camera. Overall, more money was spent on the latter two than on any other product.

It can be observed that in Britain, the highest amount of money was spent on camera (more than 160 million pounds), while similar amounts were spent on console games and outdoor game accessories. The Austrian spent the second highest amount of money on the first three products while they stood last in the latter three. It is also revealed that Spanish spent more money on toys than on any other product (a bit less than £ 150 million), but they also paid a lot for camera. Finally, Belgian spent the least overall, having similar spending figures for all 6 products compared in the bar chart.

To sum up, the British were the biggest spenders in all six categories among the nations compared in the bar chart while the lowest spending levels were attributed to the residents of Belgium.

#Sample 2:

“The chart below gives information about” Istanbul Promo plus “sales in 2007. Summarize the information by selecting and reporting the main features, and make comparisons where relevant”

IELTS writing task 1 sample

IELTS writing task 1 sample

The chart shows how Promo Plus in Istanbul fluctuated over a period of 12 months. It is observed that in the first month of 2007, Promo Plus sales stood at 200 million turkish lira and rose slightly to reach about 225 million in February. This was followed by another increase, although much steeper, in March when sales where almost 125 million turkish lira higher than February.

However, this upward trend was suddenly broken and sales plummeted dramatically over the next 4 months to reach a little over 100 million turkish lira in July. August sales showed a significant rise back to January levels as figures nearly doubled, but this was not to last as they dropped again in September to the same level as they were in July. October came with a small increase of about 100 million turkish lira in sales, after which sales figures levelled off and about relatively static over the last two months of 2007.

Overall, Promo Plus in Istanbul fairly relatively unchanged in 2007 as January and December sales were fairly equal. Also, sales were at their highest in March while the weakest sales figures could be observed in July and September.

(197 words)

#Sample 3:

“The graphs below show the development of the cutting tools made by stone, one was made 1.4 million years ago, and the other was made 800 thousand years ago, viewing from back view, front view and side view. Summarize the information by selecting and reporting the main features, and make comparisons where relevant. “

The given diagram illustrates the cutting stone tool and how it was advanced, from 1.4 million years ago to 800 thousand years ago. It can be clearly seen that the stone tool was improved into a sharper and better one, over the years.

The stone tool made 1.4 million years ago was more rounded at the top and bottom edges. From the front and the back view of the tool it is clear that the diameter in the middle was almost 5 cm and towards the top and bottom, it was around 3 cm wide. The side view shows that the tool was wider in the middle, with a diameter of around 3 cm and it tapered towards the top and the bottom ends. The back of the stone had fewer cuts than the front and they were also not very fine.

800 thousand years ago, this tool developed into a sharper, more refined tool. In the front and the back view it can be seen that the maximum diameter of the tool was the same as in the older tool, but it was more towards the lower side. The bottom tapered into a 1 cm point, but the top tapered more sharply into a 1 cm point. The side view makes it clear that it was much lesser in width (1.5 cm) than the older tool. The stone was more chiseled than the previous one.

#Sample 4:

“The graph below shows the pollution levels in London between 1600 and 2000. Summarize the information by selecting and reporting the main features, and make comparisons where relevant”

The graph shows pollution levels in London between 1600 and 2000. It measures smoke and sulfur dioxide in micrograms per cubic meter. According to the information, the levels of both pollutants formed a similar pattern during this period, but there were always higher levels of sulfur dioxide than smoke in the atmosphere.

In 1600, pollution levels were low, but over the next hundred years, the levels of sulfur dioxide rose to 700 micrograms per cubic meter, while the levels of smoke rose increased to about 200 micrograms per cubic meter. Over the next two hundred years the levels of sulfur dioxide continued to increase, although there was some fluctuation in this trend. They reached a peak in 1850. Smoke levels increased a little more sharply during this time and peaked in 1900 at about 500 micrograms. During the 20th century, the levels of both pollutants fell dramatically, though there was a great deal of fluctuation within this fall.

Clearly air pollution was a bigger problem in London in the early 20th century than it is now.

(176 words)

#Sample 5

“The charts below show the results of a survey about what people of different age groups say makes them most happy. Summarize the information by selecting and reporting the main features, and make comparisons where relevant.”

There are several similarities between what younger and older people say makes them most happy. However, there are several striking differences.

Firstly, let us look at the similarities. It is noticeable that for both younger and older people, the highest percentage says that achievement at work brings them most happiness: 31% for the younger age group and 32% for the older group. Doing hobbies is also very important for both groups: the second largest percentage of both age groups mention doing hobbies as making them most happy.

Turning now to the differences, many younger people regard having a good appearance as extremely important: 18% of them state this brings them most happiness. This is followed by 15% who state that travel brings them happiness. Neither of these two factors is mentioned by older people. Instead, 20% of older people report that having financial security is most important to their happiness and 14% say they feel most happy when they are with their family.

(163 words)

Above are 5 great special samples of IELTS writing task 1, we want to share for you who want to get to a high writing score. In the following articles, we will share more good examples with many different topics. Get ready for it!

Click to rate this post!

Unit 11 – IELTS Writing task 2 – How to describe a bad thesis

IELTS Writing task 2 - How to describe a bad thesis

If there is a compliment, there must be criticism. In IELTS Writing, the topic is usually about a “problem”, so it feels like the article must always have something “bad” or “harmful”. Therefore, it is extremely useful to know many harmful expressions in IELTS. Similar to the previous article, we should not say sentences like:

A is bad

>>>> Review the previous lesson: How to describe a good thesis

Instead, we need to focus on how specific the “bad” is. You can follow one of the following methods:

1) Use correct adjectives

There are many adjectives with negative meanings, and negative sentences like this are a good opportunity to “pull” out these adjectives. For example, instead of saying:

Overeating is bad.

Say:

Overeating is detrimental/unhealthy.

For each noun that belongs to different topics, you have very different adjectives to attach to it. For example, if something is bad, it could be illegal, harmful, wasting time, etc. If a food is bad, it could be bad, unhealthy, expensive, … Think about what words you will use in your language to describe this, and find the English word that best fits your language word you know.

2) A waste of something

A very common meaning of “bad” is “wasting something”. For example:

Watching TV is bad => watching TV is a waste of time

Shopping for clothes is bad => shopping for clothes is a waste of money.

Note: you can change “is a waste of …” to the verb “waste”

Watching TV is a waste of time => Watching TV wastes a lot of time

Shopping for clothes is a waste of money => Shopping for clothes wastes a lot of money

3) A reduction of something of B

This is a fairly colorful way to interpret the subject’s “bad” in more detail. Take for example: watching lots of TV harmful to children. Think about what “watching TV” reduces to “children”.

There are many things, right? The “watching TV” can reduce first is the dynamism, moreover is the time for family, interaction with parents.

Watching TV is bad for children

=> Watching TV reduces children’s activity level.

=> Watching TV shortens the time children spend with their parents.

4) A raises something “bad” in B.

Similarly, we can rewrite in the opposite way that A raises an already “bad” quality in B.

For children, in contrast to the dynamic, it is definitely … tedious, cake dirt, lazy. Contrary to the time spent with parents, it is likely that children will be exposed to violence that is not suitable for their age.

Watching TV reduces children’s activity level => Watching TV encourages children’s laziness.

Watching TV shortens the time children spend with their parents => Watching TV means children are spending more time watching violent content.

Here are 4 easy to use methods to help you better describe the “bad” quality. You don’t have to stick to one method and use it for the whole article. Mixing all 4 ways together will give you a lively essay and show more language skills!

Click to rate this post!

Unit 6 – Writing task 2 – Read and understand the topic in Writing task 2

Read and understand the topic in IELTS Writing Task 2

One of the most basic requirements, if you read the grading barem, of Writing, is “address the question”. The question asks me what, I have to answer that. It sounds simple, but the reality is that there are too many friends who are “adventurous”, focusing on “topics” rather than asking questions. So, we need to determine the problem requirements before we start writing Task 2.

Task 2 has 4 main types of topics:

A. Opinion

This topic usually has common sentences such as:

– How much do you agree with this statement?

– Do you agree with this statement?

– To what extent to do you agree with this statement?

You can easily identify this topic when it asks if we have: agree or disagree with a point raised earlier.

With this form, you can choose to follow one of two directions: (1) totally agree / disagree or (2) half lean and half fat (partly agree). With the complete form, you will follow the structure:

Open lesson => Reason 1 => Reason 2 => Summarize

With half lean, half fat form, you will write:

Post => Aspect agree => Disagree aspect => Summarize

Whichever type of answer you choose, the examiner will not judge whether you chose “true” or “false”. However, according to the experience of 99% of IELTS test takers, going “completely” is always safer and easier to write. There are some things that would be silly to write both yes and no, for example:

Smoke:

=> Idea 1: extremely harmful to health

=> Idea 2: looks very cool

Obviously, going in the “completely” direction will be a lot easier to write. Remember, the examiner doesn’t care what you answer, people just care how you express the answer.

B. Discuss / Discuss + Opinion

This article is easy to recognize, because it simply has the word … discuss. The discussion will give you 2 points. It may ask you:

– talking about 2 points of view (A)

– talk about 2 views + give your opinion (B)

This article is also quite easy to write, with type A, you just need to write:

Open lesson => Viewpoint 1 => Viewpoint 2 => Summary

With type B, people will ask what opinion you support, that is, you will have to choose. After choosing the opinion that you support, you will write

Open lesson => Viewpoint 1 => Viewpoints that I support => Summary

Note, when writing point 1 in form B, not that you “object” to this view. You simply give out the reason why others support it.

C. Problems + Solutions

We can identify this form of post quite easily by the phrases:

– What are the causes?

– What do you think causes this?

– What are the solutions?

In short, see “causes” & “solutions”. The way of writing this article is simple:

Open the post => Causes => Solutions => Emphasize the need to do right solutions

When writing causes and solutions, the easiest way is to write in an enumeration, for example

– Causes: There are a number of causes to …

– Solutions: A number of solutions can be used …

Then list out the causes and solutions. Quite systematic and simple.

D. 2-part questions

Finally, there are 2-part questions, which are quite easy to recognize because there will be no sign words for the above forms, but 2 question marks.

=> …? …?

This is also very easy to write:

Go to lesson => Answer question 1 => Answer question 2 => Finish lesson

So here are 4 types of topics in Task 2, please pay attention to write as required so you don’t get lost!

Click to rate this post!

Unit 4 – Writing task 1 – General comment in IELTS Task 1

General Comment in IELTS Task 01

There is a very important part that is very easy to write in IELTS Writing Task 1 that many people take the exam or ignore, which is the general comment. In the right order, the first task when writing Task 1 is to paraphrase the topic, and before going into describing the details of the drawing, you must write a summary of about 1-2 sentences. You should note that never write more than 2 sentences to summarize, because if you write more, you are writing too specific.

So what do you need to write in the general comment section? Simply what catches your eye first. However, our eyes are not the same. The details you immediately notice may not be seen by others. So, a good rule of thumb for all Task 1 lessons is to: comment on the overall trend and / or order comments.

For this general comment, you should have a sentence template to get started. The most common, easy and effective sentence patterns are:

It is immediately obvious that … = Immediately obvious that …

There are also other spellings such as: It can be seen that …, it is transparent that …, etc. Notice that ways like “I can see” or “we can see” are not mentioned. In Task 1 as well as Task 2, we always try to avoid the use of human pronouns (I, you, we, they, he, she), because these words reduce the formality of the sentence. .

You can also add at the beginning of the phrase:

Looking at the graph / chart / diagram / picture …

In addition to the sentence pattern above, we have a sentence like “Looking at the chart, we have …” quite similar in math. This is an easy-to-remember sentence pattern that every candidate should understand and memorize to make the test smooth and effective.

A. Look in order

With the multi-line graphs or objects as above, ask yourself: which one is the largest or has the highest proportion? So, with the chart above you can write:

Looking at the graph, it is immediately obvious that people in Germany spend the most money on books out of the four countries.

B. Looking at the general trend

For items that have few objects (1-2 subjects) or no clear order, you should comment on the overall trend of all subjects. Although in the picture above, the order of the lines has changed, but in general, the trend of the lines is going up, because the end point is higher than the starting point. You can write:

Looking at the graph, it is immediately obvious that all three countries experience an increase in the number of people aged 65 years and over.

C. General commenting process (Process)

So what about non-numerical articles and trends like Process? For Process threads, you will write a general sentence to group the steps into the main stages: what to start with and what to end with. For example, study the following topic:

The above diagram can be divided into several steps, however, we can divide it into the main stages as follows:

  • Getting started: use limestone and clay to create cement
  • Finish: using cement and other materials to create concrete

After writing the opening sentence: The diagram shows …, we can add the general comment section right behind without having to go to a new sentence:

The diagram shows …, beginning with transforming limestone and clay into cement and finally adding that to a combination of other materials to produce concrete.

D. General comment Maps

Please rely on the peculiarities of maps to comment on it. All maps show the change of a place over the years, and this change usually revolves around the addition and loss of buildings (buildings, roads, …). The map above is a difficult problem of a difficult problem. However, you can see the change of this map taking place in two aspects: the appearance of roads and the appearance of new buildings. If you pay close attention, new buildings only appear after roads are built. So, you can write:

Looking at the picture, it can be seen that more buildings emerge in the village following the construction of different types of roads.

Click to rate this post!

Unit 1: Complete Writing Task 1 Structure in IELTS Test

Complete Writing Task 1 Structure

The soul of the Writing section can be said to be in the Task 2 Section. Saying that doesn’t mean you can leave the “blank” part of Task 1. However, a lot of you spend too much time on Task 1. , which takes 30-40 minutes, leads to Task 2 writing very poorly, although Task 2 is much longer. To avoid this, you need to know the complete layout of Task 1 to write quickly and accurately and spend a lot of time on Task 2.

In Task 1, there are two main forms: charts and … not charts (processes – maps or maps). The diagram is related to the numbers and their ups and downs, the process is clearly focused on the steps, the sequence, and finally, the map has a focus on the description, usually a description of the change. over the years of an area.

1. Chart form

The chart format is the easiest to write of the three types, and fortunately, this is the most frequently proposed format in Task 1. To write a chart, you need to follow these steps:

Paragraph 1 (1 sentence): Paraphrase (rewritten in a different way) first sentence (this table shows / this graph shows …)

Paragraph 2 (1-2 sentences): Write a general comment (what first caught my eye)

Paragraph 3: Write descriptive sentences from largest to smallest.

– No conclusion.

You may notice that there are many numbers in the chart, but we will not describe them all, we will just say what stands out. If the lesson has 2 charts, we will describe them one by one in order. Perhaps these two charts are related to each other (2 different years of the same data), or 2 completely independent data types. If they are relevant, when writing the second one, remember to compare.

2. Process type.

The process format is fairly easy to write, and sometimes easier than the chart format if you know how to write:

Paragraph 1 (1 sentence): Paraphrase again deals (similar to the chart)

Paragraph 2 (2 sentences): Overview of what this process starts with and ends with.

Paragraph 3: Describe each process and lead it by sequence words. The easiest of the earth is to follow the style (Firstly, Secondly, Next, Then, … Finally)

Paragraph 4: You can write all the procedures into a paragraph like paragraph 3, or separate a fourth paragraph to talk about the final process.

Notice that in the form of a procedure, all you need to write is given in the diagram. You just need to diversify it by writing active / passive sentences.

3. Map form

Similar to diagrams and processes, you must always write the first 2 paragraphs as follows:

Paragraph 1 (1 sentence): Paraphrase again examines (What does this map draw)

Paragraph 2 (2 sentences): Describe the most pronounced changes on the map

The body of the card is where the map is different from the two above. In this section, you need to describe the changes on the map. The easiest way is to follow the year, from the earliest years to the most recent years: which one has more, which one loses.

Paragraph 3-4: Describe in detail the changes from year to year. The number of paragraphs can be 1-3 short paragraphs, however, in this article we should only write 2 body paragraphs, ie 4 paragraphs of the whole article is sufficient. The maps do not have too many things to describe, so writing many paragraphs will look very thin.

Click to rate this post!

Download The Complete Guide to Task 1 Writing by Phil Biggerton

The Complete Guide to Task 1

How to write IELTS Writing Task 1 in a logical, complete, systematic and better way? The Complete Guide to Task 1 Writing by Phil Biggerton will be a document not to be missed when preparing for IELTS. Wiki Study English introduces this book below, you can download to learn gradually.

The Complete Guide to Task 1 Writing is a book written by Phil Biggerton with content related to writing short essays of the IELTS Writing Task part 1. The book helps learners improve their writing skills, self-idea, total scientifically, the specific interpretation is easier to understand. This book is suitable for beginners (basic) to those who want to study more advanced, expand the scope of the tough IELTS test so you can easily use it.

In the book, the author guides step by step from simple to advanced writing IELTS Writing Task 1. You will be familiar with how to write the correct structure, select information, avoid common mistakes. The articles are illustrated and analyzed by easy-to-understand diagrams such as bar charts, lines, tables, maps, etc.

Under the knowledge is an example with answers, very simple small exercises for you to study and practice on your own. In addition, the book offers helpful tips to help you avoid common mistakes on the test to help you get better grades.

Content IELTS The Complete Guide To Task 1 Writing:

Unit 1: Writing an introduction
Unit 2: Writing a general statement
Unit 3: Writing a body
Unit 4: Analyzing diagrams with a time period
Unit 5: Analyzing diagrams with no time period
Unit 6: Analyzing multiple diagrams
Unit 7: Processes
Unit 8: Cycles
Unit 9: Flow charts
Unit 10: Objects
Unit 11: Maps

Tip: To study best, you should buy hard copies at bookstores. The price of this book is not very expensive so a good pillow is also good!

Now you can Download The Complete Guide to Task 1 Writing by Phil Biggerton below link here:

Download

Wish you all good study!

Click to rate this post!